How to create your first check on okokumo
2026-08-18
Monitoring is only useful if somebody hears about it. That's why this walkthrough sets up the alert channel before the check: a check with nowhere to send an alert measures your site perfectly and tells nobody, which is the one failure mode a monitoring tool must never have.
Ten minutes, five steps. A free account covers all of it except the last two.
1. Create an alert channel
Open Alert channels from the dashboard header and press New channel.
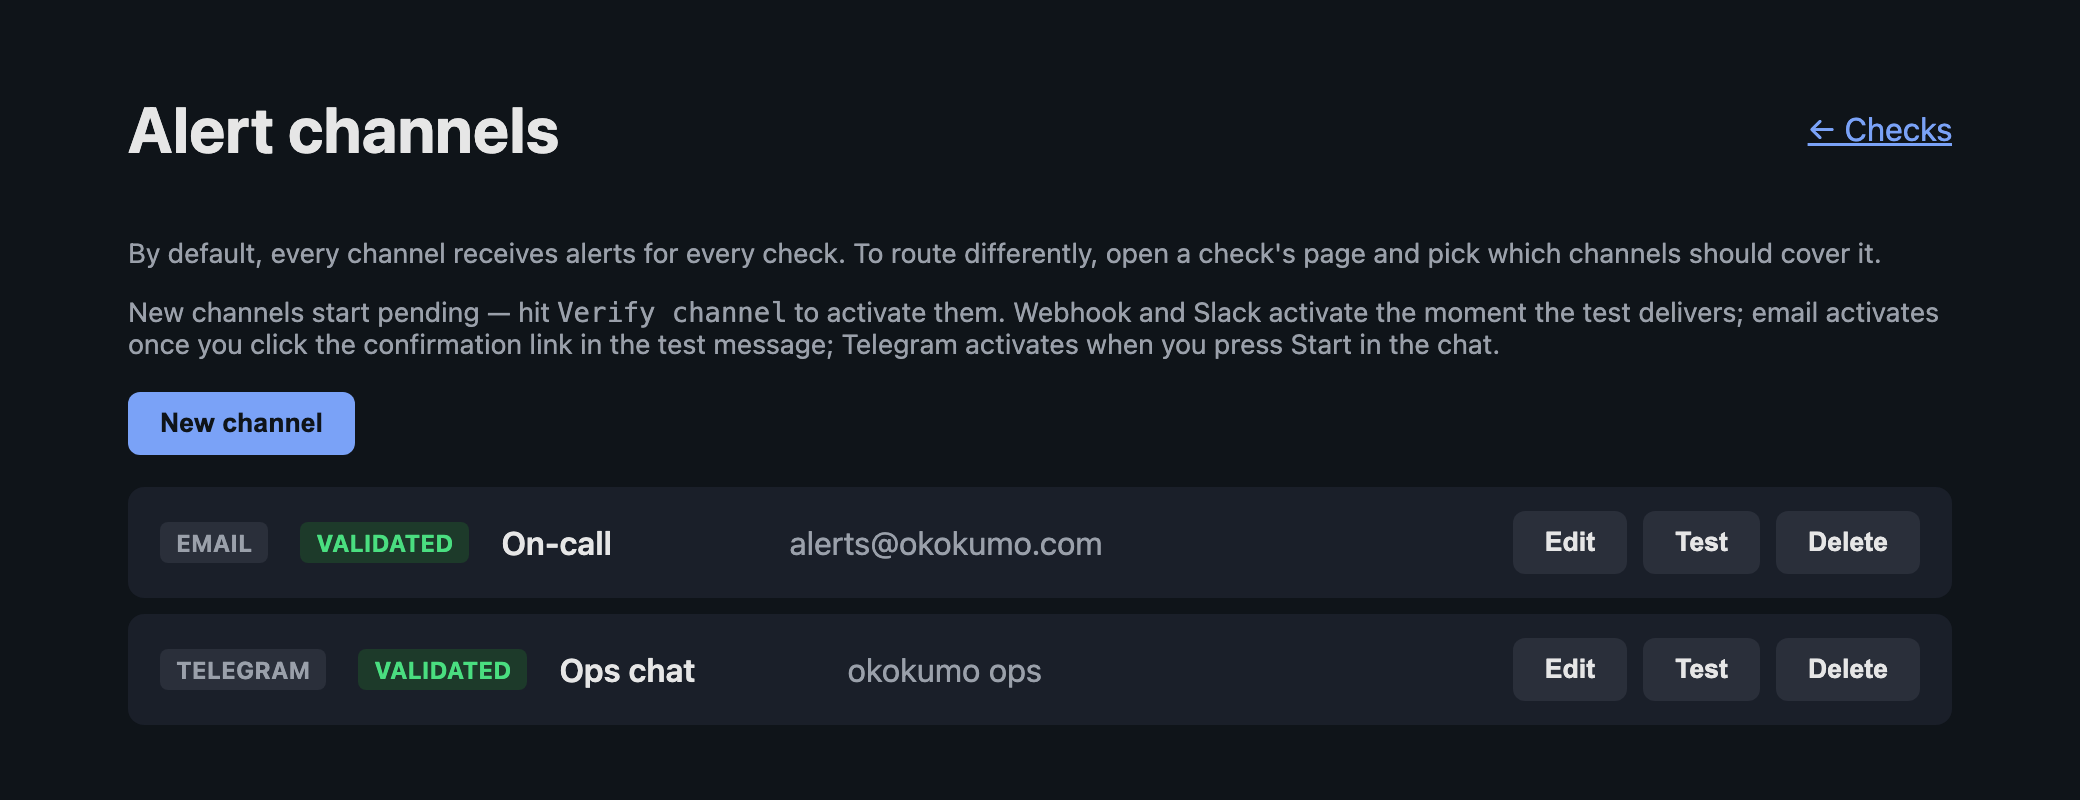
Channels are org-wide by default: every channel receives alerts for every check, until you decide otherwise.
Five kinds:
- Email — one address per channel.
- Telegram — press Connect, then Start in the chat that opens. We run the bot, so there's nothing to create on Telegram's side.
- Slack — paste an incoming-webhook URL from your Slack app settings.
- Discord — paste an incoming-webhook URL you create in your own server: Channel → Edit Channel → Integrations → Webhooks → New Webhook → Copy URL. Alerts arrive as an embed, red for down and green for recovery, with the title linking back to the check.
- Webhook — any HTTPS endpoint. Every delivery is signed with HMAC so you can verify it came from us; the payload is documented in the API reference.
New channels start pending, and a pending channel receives nothing. How a channel activates depends on what it is: webhook, Slack and Discord activate as soon as a test delivers, Telegram activates when you press Start, and email activates when you click the confirmation link in the test message. That last one catches people out — hit Verify channel, then actually open the mail. One exception: an email channel pointed at the verified address you signed up with is already confirmed, since that link already proved you own the mailbox.
If you skip this step, the dashboard says so on the check itself: "Nobody will be paged." We would rather nag you than be quietly useless.
2. Create the check
Back to Checks, then New check.
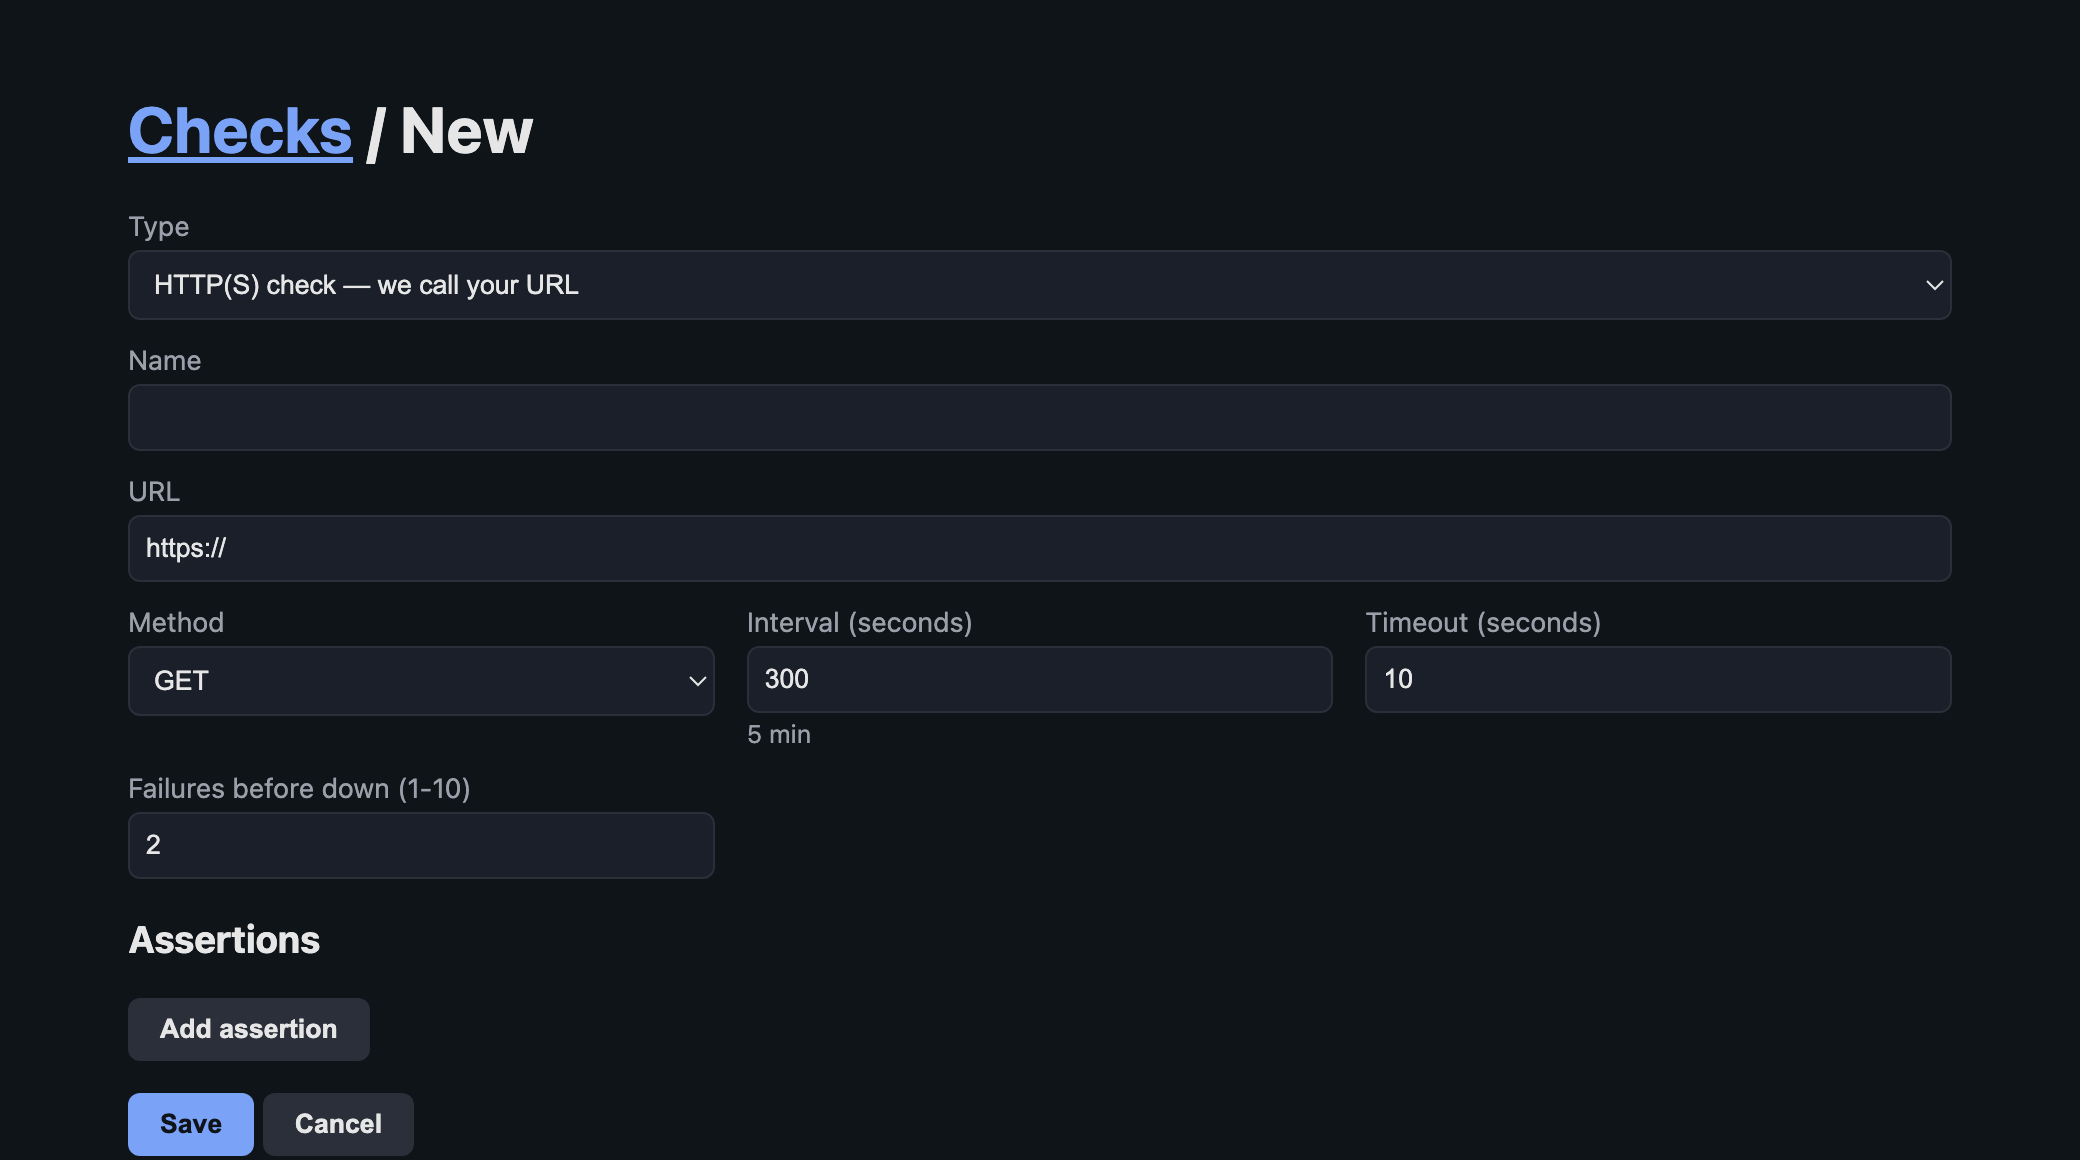
The interval field is in seconds, with a plain-language echo underneath — 300 reads as “5 min”, 86400 as “1 day”.
The fields that matter:
- Type — HTTP(S) for a URL we call; heartbeat or cron for a job that calls us; TLS or domain for certificate and registration expiry.
- Interval — from 30 seconds to 24 hours. Your plan sets the floor: 5 minutes on Free, 1 minute on Starter, 30 seconds on Pro and Business.
- Timeout — how long we wait for a response before calling it a failure.
- Failures before down — 2 by default. On top of this, a failure has to be confirmed from a second probe region before anyone is paged, so a hiccup in one datacentre doesn't wake you at 4am.
- Assertions — optional. Status code, maximum latency, a string the body must contain, a header value. A check with no assertions passes as long as the request completes at all, which is usually not what you want: assert the status code at minimum.
Press Save and the first probe runs within one interval.
3. Read the list
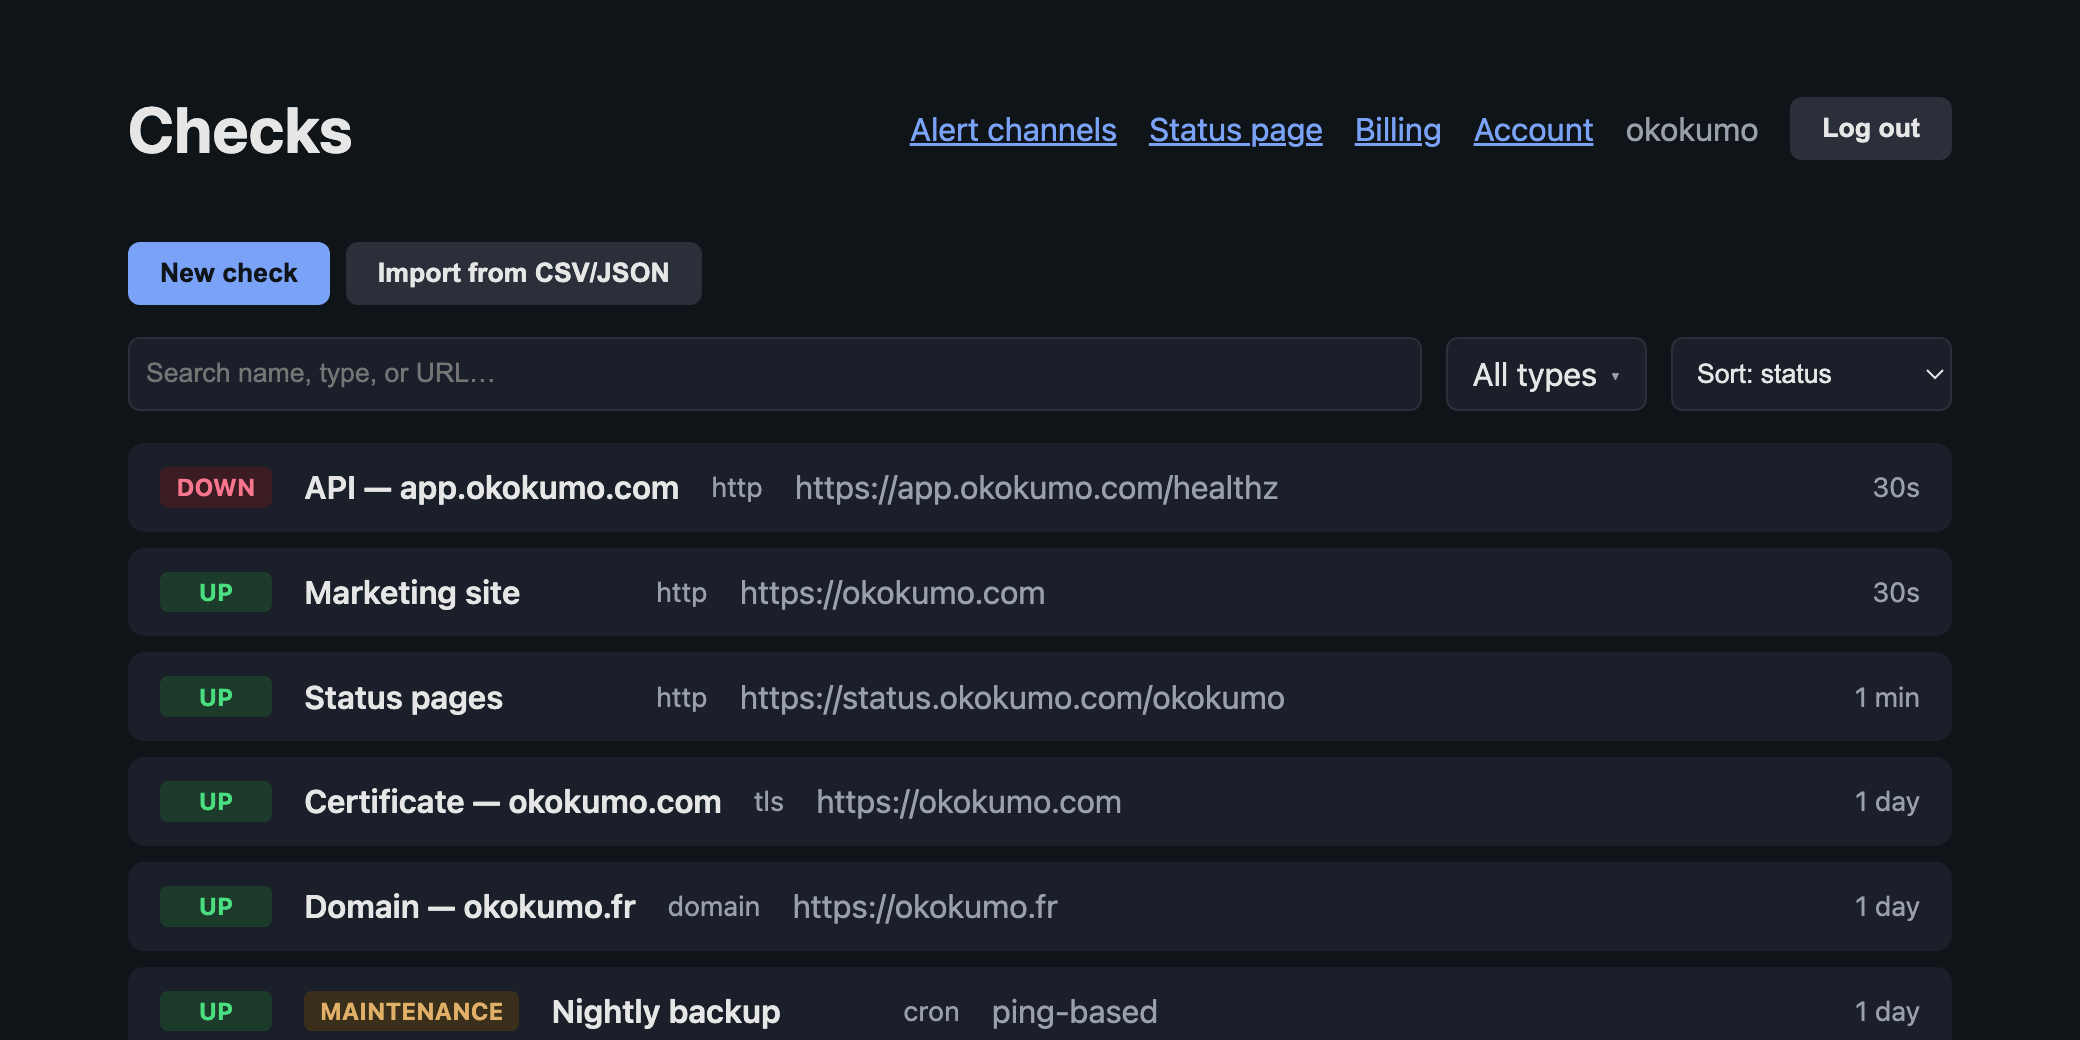
Down first, then unknown, then up — during an incident the thing you need is at the top.
A check sits in one of three states. Up and down are self-explanatory; unknown means we haven't probed it yet, or you've paused it. A check in a maintenance window carries an amber badge: we keep probing it, so your uptime history stays honest, but alerts are suppressed until the window ends. If it's still down when the window closes, you get told then.
4. Read the check when something breaks
Click any check.
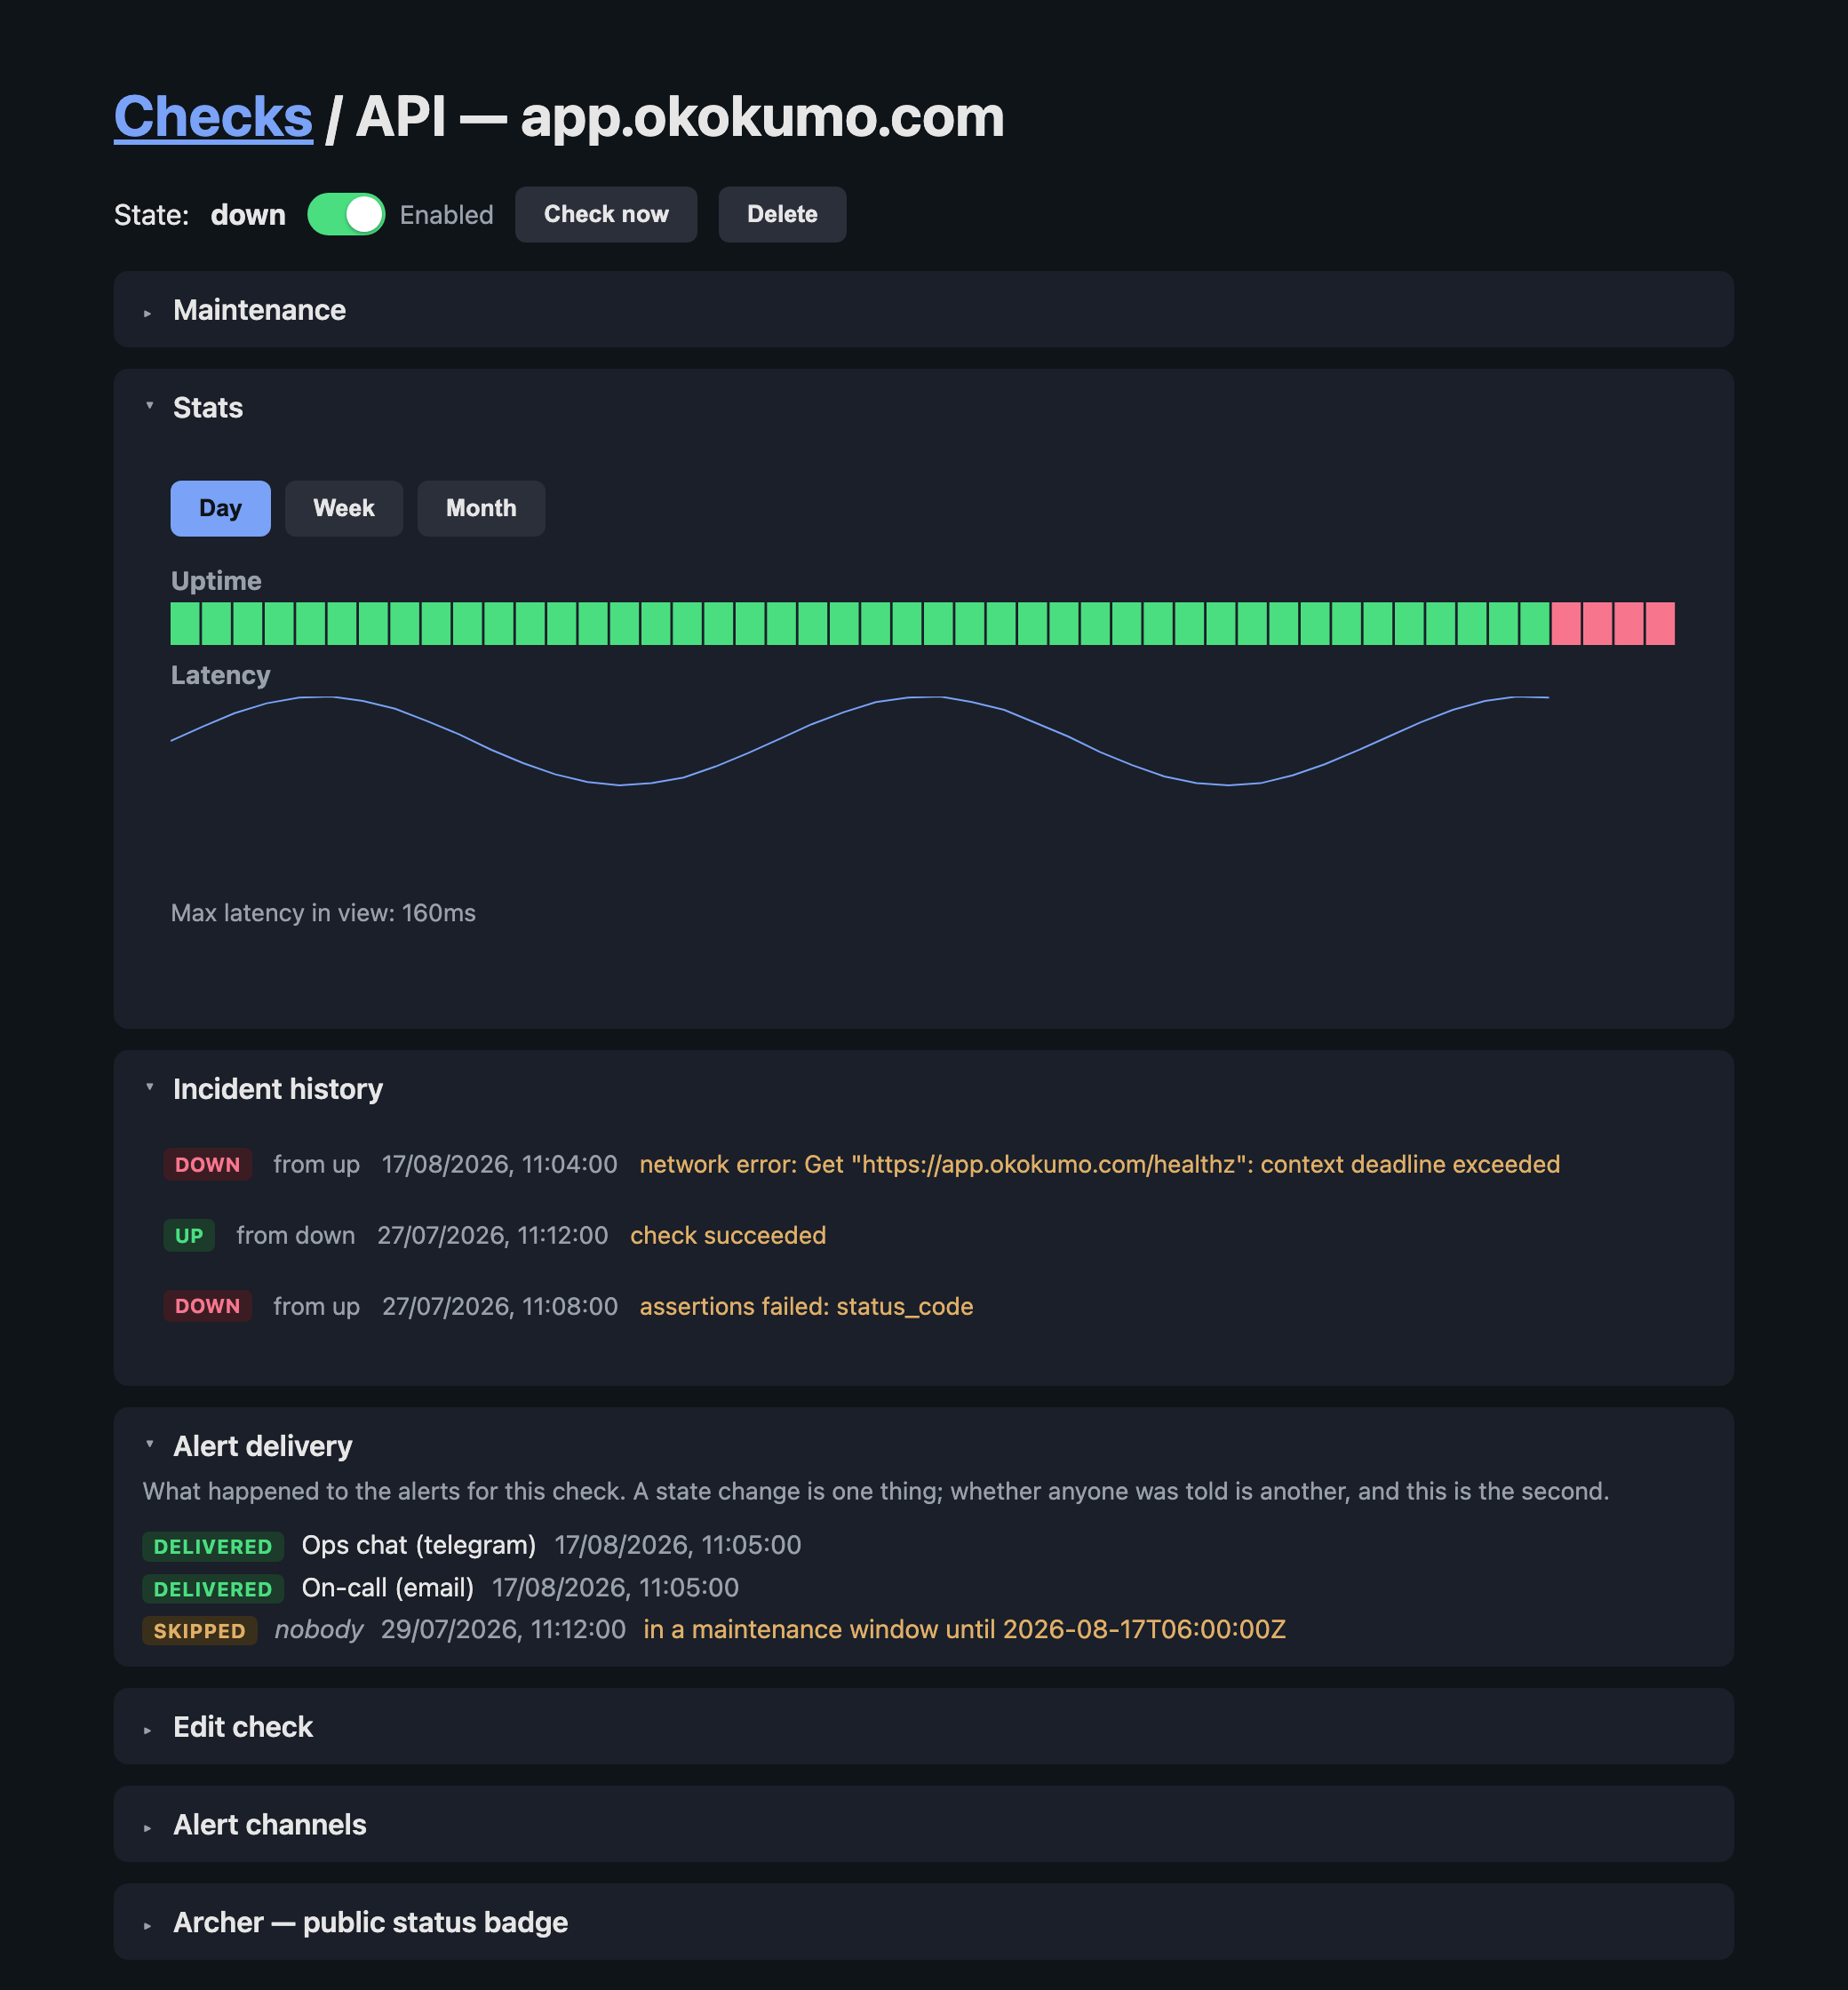
Uptime and latency for the period, every state change with its reason, and — underneath — what happened to each alert.
Three things worth knowing here:
- The charts cover a day, a week or a month, aggregated server-side.
- Incident history lists every state change with the reason we recorded:
assertions failed: status_code,certificate expires in 30 days, the network error verbatim. - Alert delivery is the part other tools don't show you. Every attempt is logged: delivered, failed, or skipped with the reason — no confirmed channel, a maintenance window, or routing that excludes every channel. If you ever wonder "was I actually told?", the answer is on this page rather than in our logs.
By default every channel in your organisation gets every alert. To narrow it, open Alert channels on the check and pick specific ones — useful when a noisy staging check shouldn't hit the on-call phone.
5. Optional: a status badge, and a status page
Two ways to show the outside world what you already measure.
Archer puts a live badge on your own site — a ring or a 30-day bar, light or dark. Enable it on the check's Archer section and drop the snippet anywhere:
<iframe
	src="https://app.okokumo.com/embed/YOUR_TOKEN"
	width="220"
	height="64"
	style="border:0"
	title="Service status"
></iframe>
The token is opaque and read-only: it exposes the badge and nothing else — not the URL being checked, not its internal name. Available on any paid plan.
Tower is the bigger version: a full status page for your customers, on Pro and Business.
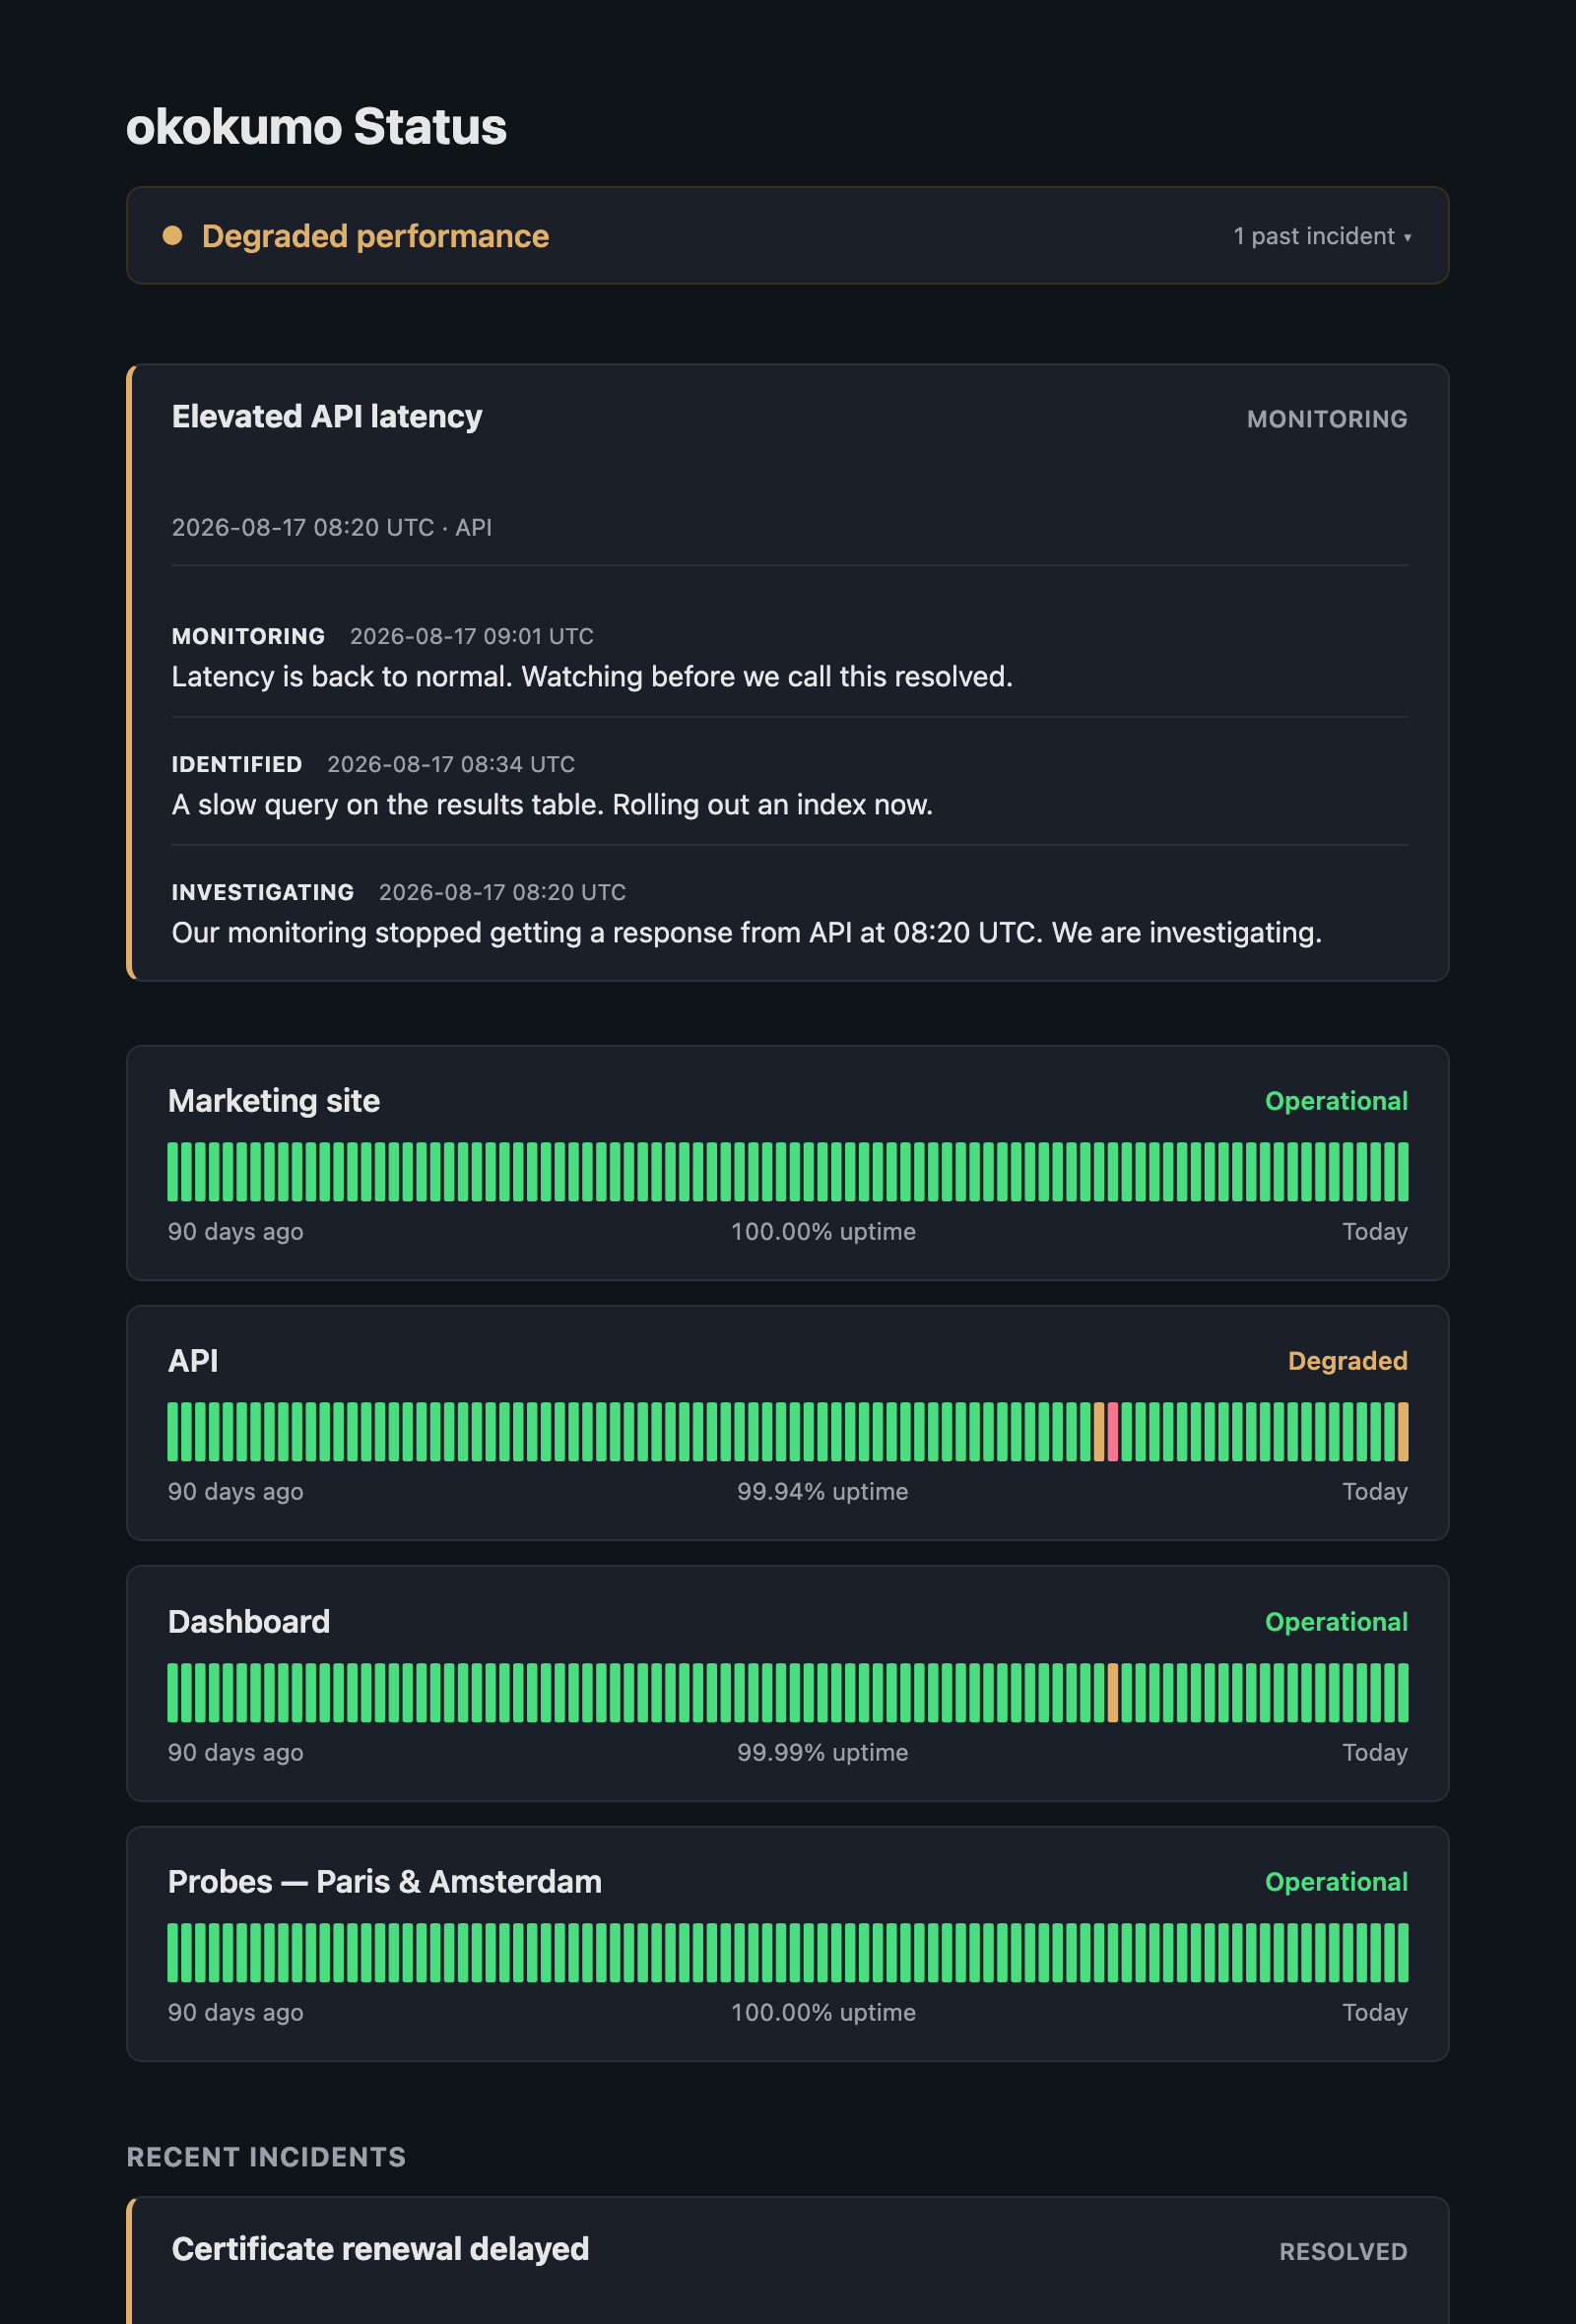
Components you name, 90 days of history each, and incidents with a timeline.
You choose which checks appear and what they're called — publish "API", not
prod-api-lb-healthz. Nothing else about a check is ever exposed. When a
component goes down we draft the incident for you, with its timeline already
running, and post the recovery note when it comes back; the draft stays
private until you publish it, because words in your voice on your page
should be yours first. On Business the page can be served from your own
hostname — status.yourcompany.com — with a certificate we obtain and renew.
Doing all of this from a script
Everything above is in the API, if you'd rather not click:
curl -s "$SENTINEL_URL/v1/checks" -H "Authorization: Bearer $SENTINEL_KEY" \
	-H 'Content-Type: application/json' \
	-d '{
		"type": "http",
		"name": "API",
		"url": "https://example.com/health",
		"interval_seconds": 60,
		"assertions": [{"type": "status_code", "value": "200"}]
	}'
Bulk import from CSV or JSON is there too, with a dry-run preview before anything is written. Full details in the API reference.
What you have now
One check, probed from two EU regions, alerting a channel you confirmed, with a record of every alert we sent or deliberately didn't. That's the useful minimum — and on the free tier it costs nothing to leave running.